
Macroeconomics Part 1: Introduction
- May 3, 2025
- 3 min read
Updated: May 10, 2025
Written by: Caroline Kim
May 3, 2025
Economics is an integral part of society, the world of business, political climate, international relations, public policy. Especially with so much ongoing talk of how the economy will fluctuate due to new policy implementations, staying informed is key. We’ll conduct a multi-part series, but today, we’ll discuss the fundamental components of economics. Key terms and topics of discussion to anticipate include supply & demand, consumer & producer surplus, and price ceiling & price floor.
Economics can be described as the study of the allocation of resources given the coexistence of unlimited wants and limited resources. The first item to consider is the production possibilities frontier. This graph essentially depicts the relationship of the production between quantities of two items; points beyond the curve are unattainable, points within the curve are attainable but not productively efficient, and points along the ppf are attainable and efficient. Below in figure 1 is a graphical representation of this concept. The activity of the PPF can be related to opportunity cost, which is an equation of what must be given up over what is gained.

Arguably the most fundamental pieces of economics are the supply and demand curves. Demand can be defined as the relationship between a product/service and the quantity demanded of that same good or service. The demand curve is negatively sloped indicating that as price falls, demand increases and vice versa; this is the law of demand. A key distinction to note is that demand refers to the entire demand curve and shift of the curve itself while the quantity demanded refers to movement along the demand curve. Increased demand would cause the demand curve to shift right, and decreased demand causes the demand curve to shift leftwards. Demand shifters include income, prices of related goods, expected future price, and preferences of consumers. Supply on the other hand is the relationship between the price of a good or service and the quantity supplied of that same good or service by sellers. The supply curve is positively sloped, because as price rises, supply increases, and as price falls, supply decreases; this is the law of supply. Similar to demand, the supply refers to shifts in the entire curve whereas quantity supplied refers to movement along the supply curve. Supply shifters include the number of sellers, technology, cost of production, price of related goods, and future expected price. Market equilibrium refers to the price at which the quantity demanded and the quantity supplied are equal.
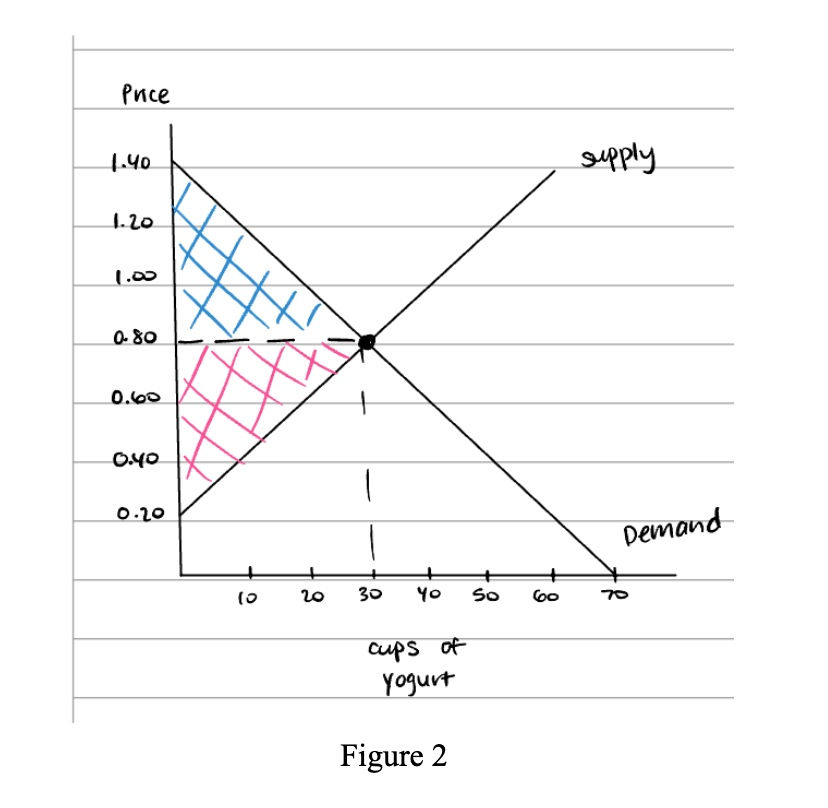
Consumer surplus measures the amount by which consumers are made better off when they buy a particular good or service; this is the difference between a consumer’s maximum willingness to pay for a good or service and the price they actually pay. Similarly, producer surplus can be defined by the amount by which firms are made better off when they sell a particular good or service. When the market is not at equilibrium, part of what would have been the producer or consumer surplus is now allocated to deadweight loss; as ar result, total surplus has dropped. Figure 2 shows consumer surplus and producer surplus at equilibrium figure 3 depicts consumer surplus, producer surplus, deadweight loss.

Price ceilings are the maximum allowable price for a good or service set by the government, and it only is effective if it is set below the equilibrium point. On the other hand, a price floor serves the purpose of setting a minimum allowable price set by the government, and it only is effective if set above the equilibrium price. These changes to the market can result in various changes in the distribution of consumer & producer surplus and deadweight loss.
Lastly, we’ll briefly explore key topics of economics starting with types of taxes: excise tax (ex. Cigarette tax) and ad valorem tax (ex. Property tax). Government taxes cause the selling price to increase by the tax amount, resulting in the price consumers pay to increase and the price sellers receive to decrease. This graphical representation of taxes can be seen in figure 4. Exports are goods and services that are produced and sold to foreign consumers whereas imports are goods produced abroad but consumed by domestic individuals and households. This brings into discussion what is known as the world price; the world price is the prevailing international price at which domestic consumers can purchase a specific good or service, and domestic sellers can sell that good or service. Figure 5 represents how tariffs impact markets for avocados.


Sources:
Caroline Kim- Personal Notes/Graphs
Professor Thomas Knight - University of Florida Spring 2025 ECO2013
Comments